Data Analyst Resume
A data analyst resume is read twice: first by software matching keywords from the job posting, then by a person who wants to know what changed because you were there. This page walks through an example analyst resume, the sections that carry the most weight, and the SQL, BI and experimentation keywords that actually get matched.
Free forever. No account, no card, no catch — your data never leaves your device.
What a data analyst resume must include
- A headline that names your specialism — product, marketing, finance, supply chain, healthcare — rather than just “Data Analyst”.
- A three-line summary with your years of experience, the tools you live in, and one number that shows scale.
- Experience bullets that open with the outcome, not the tool. The tool belongs in the same sentence, never in place of the result.
- A skills block grouped by query languages, BI tools and data stack, because those are what most postings filter on first.
- A portfolio link — Tableau Public, a public repository, or a written analysis — since analysts are hired on demonstrated work more than most roles.
- Education and any certifications, kept short unless a posting names a specific credential.
Analysts have an unusual problem: the work is invisible. Nobody sees the query, the join that was wrong for a week, or the refresh you rewired at the last minute — they see the decision that followed. A resume has to convert that invisible work into visible outcomes, which is why every bullet should name a decision, a saving, or a change in how a team behaves.
Data Analyst Resume Example
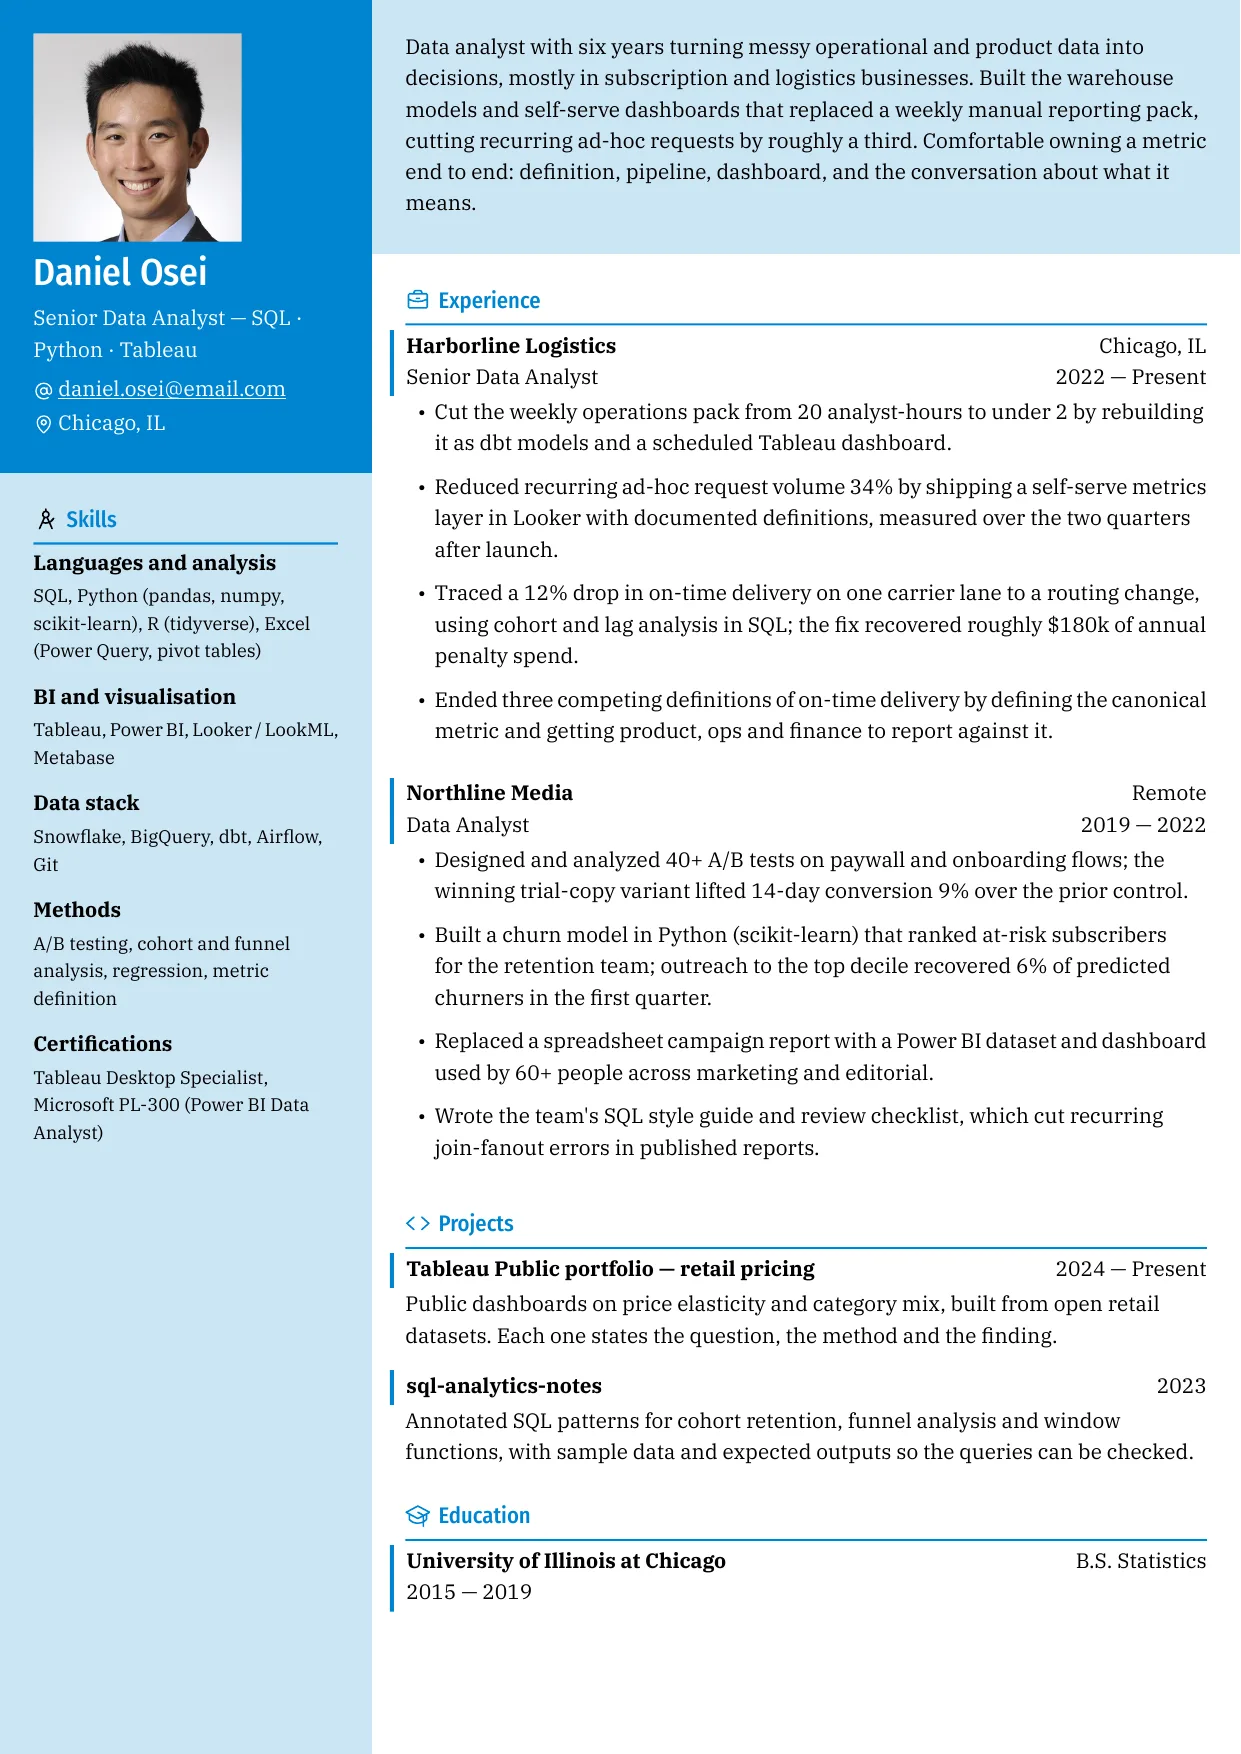
Example resume
A single-page data analyst resume with the outcome-first bullets described below. Replace the numbers with your own before you send it anywhere.
Showing 3 of 15 free templates — open the builder to browse every layout. All 15 are free.
Writing analyst bullets: outcome before method
Most analyst bullets read like a tool inventory: “used SQL and Tableau to build reports”. That says what you touched, not what you did. Reorder each bullet so the result comes first, the method second, and the scale third. Three rewrites show the pattern:
- Before: “Responsible for building dashboards in Tableau.” After: “Replaced a manual weekly operations pack with a Tableau dashboard used by 60+ people, cutting recurring ad-hoc requests by roughly a third.”
- Before: “Worked with large datasets using SQL.” After: “Queried a 400M-row event table in BigQuery with window functions to isolate a checkout drop-off that only affected returning mobile users.”
- Before: “Helped the marketing team with campaign analysis.” After: “Analysed 40+ A/B tests on trial copy; the winning variant lifted 14-day conversion 9% against the existing control.”
Data analyst skills and keywords
Applicant tracking systems match your resume against the posting, and analyst postings are unusually literal: many name a specific SQL dialect and a specific BI product. Mirror the posting's wording wherever it is genuinely true of you, and name the dialect instead of writing “SQL” on its own.
- Query and languages: SQL (PostgreSQL, T-SQL, BigQuery Standard SQL, Snowflake), Python (pandas, numpy, scikit-learn), R (tidyverse, ggplot2)
- BI and visualisation: Tableau, Power BI, Looker and LookML, Metabase, Mode, Sigma
- Data stack: Snowflake, BigQuery, Redshift, dbt, Airflow, Fivetran, Git
- Methods: A/B testing and experiment design, cohort and funnel analysis, regression, forecasting, metric definition
- Spreadsheets: Excel and Google Sheets, including Power Query, pivot tables and lookups
- Domain vocabulary: the metrics and terminology of the industry you are applying into
ATS notes for data analysts
- Name your SQL dialect. Postings often require a specific one, and a parser treats “SQL” and “T-SQL” as different requirements.
- Spell BI product names the way the posting does. Power BI, PowerBI and Power BI Desktop are matched differently, and Looker is a different product from Looker Studio.
- Put the evidence in text, not only in a screenshot. A parser cannot read a chart, so describe the analysis in a bullet and keep the portfolio link as a link.
- Avoid multi-column layouts and tables for the skills block. They are common on analyst resumes and they scramble the reading order a parser extracts.
- Express metric definitions in words. A parser reads “cut on-time delivery failures 12%”, not the axis labels on an image.
- Use standard headings — Experience, Education, Skills — because unusual ones can be treated as unrecognised content.
None of this makes a shallow analysis look deep, and none of it changes how any particular employer screens. What it does is make sure the work you actually did survives the trip from your warehouse to the recruiter's screen.
Analyst postings filter hard on dialect and BI names before a person reads a word, so the formatting has to be as literal as the keyword list. ShitResume gives every template one linear document structure, which keeps SQL, dbt and Tableau terms in the context of the outcomes they produced. There is no fee and no trial version.
ShitResume does not charge for templates or exports, and it stores your work locally in the browser, so query snippets, pipeline names and salary figures stay on your device. No account is created along the way. Your job is proving what the data says; your resume should not be a data-sharing agreement.
Skills and keywords for this role
Use the terms that genuinely describe your work — an interviewer will ask about anything you list.
- Query languages: SQL (PostgreSQL, T-SQL, BigQuery, Snowflake), Python (pandas, numpy), R (tidyverse)
- BI and visualisation: Tableau, Power BI, Looker and LookML, Metabase, Mode, Sigma
- Data stack: Snowflake, BigQuery, Redshift, dbt, Airflow, Fivetran, Git
- Methods: A/B testing, cohort and funnel analysis, regression, forecasting, metric definition
- Spreadsheets: Excel and Google Sheets, including Power Query, pivot tables and lookups
- Domain knowledge: the vocabulary of the industry you are applying into
Frequently asked questions
Do I need a portfolio to get a data analyst job?
It matters more here than in most fields, because your output is often invisible to the people hiring you. Two or three pieces are enough: a dashboard on Tableau Public, a SQL or Python analysis in a public repository with the question stated up front, and ideally one piece of writing that explains what you found and what you would do next. Recruiters rarely read all of it, but the link signals that you have produced work someone could inspect.
How much SQL should I list on my resume?
Be specific rather than thorough. Instead of the bare word SQL, name the dialects you have genuinely worked in and let a bullet show what you did with them — window functions, CTEs, query tuning. If an interview is likely to include a live SQL exercise, list only what you can write without help, because anything on the page is fair game for a question.
Should I include Excel on an analyst resume?
Yes, if you have used it seriously. Plenty of teams still run on spreadsheets, and Power Query, pivot tables and lookups are real skills rather than filler. What to avoid is listing Excel as your only tool, which reads as a candidate who has not worked with a warehouse.
How do I show impact when I don't own a revenue number?
Use the proxies that exist in your world: hours of manual reporting removed, how many people use the dashboard you built, the ad-hoc requests that stopped recurring, the size of the decision your analysis informed, the number of experiments you ran. Quantifying time saved and manual work removed is honest, and usually more believable than claiming credit for a revenue shift you did not control.
Is a statistics or data degree required?
It depends on the employer. Some screen on a quantitative degree, while others hire from bootcamps, adjacent fields or internal moves, and many weigh demonstrated work more heavily than the major on your transcript. If your degree is in something else, let the portfolio and the tooling do the persuading, and check what the specific posting asks for: entry-level certificates such as the Google Data Analytics Professional Certificate, and BI credentials such as the Tableau Desktop Specialist or Microsoft PL-300, are recognized by some employers and ignored by others.
How should I describe dashboards on my resume?
Describe what the dashboard changed, not what it contained. How many people use it, how it now refreshes compared with the manual process it replaced, and whether recurring questions stopped are all stronger than a list of chart types.
Should I mention the data cleaning work I do?
Yes, framed as reliability rather than chores. A large share of analyst time goes into cleaning, joining and validating data before any analysis starts, and hiring managers know it. Turn it into a result: models that removed manual fixes, a validation check that caught bad records before they reached a report, or documented metric definitions that ended three competing versions of the same number.